


# Heatmap Tile Overlay
# Overview
BreezoMeter generates air quality and pollen heatmaps through its APIs, which also provide access to tile image overlays (PNGs). BreezoMeter currently offers four different heatmaps:
- Air Quality Breezometer AQI
- Air Quality Traffic Pollution
- Air Quality PM2.5
- Pollen Daily Forecast
Each map can be requested individually using its own endpoint.
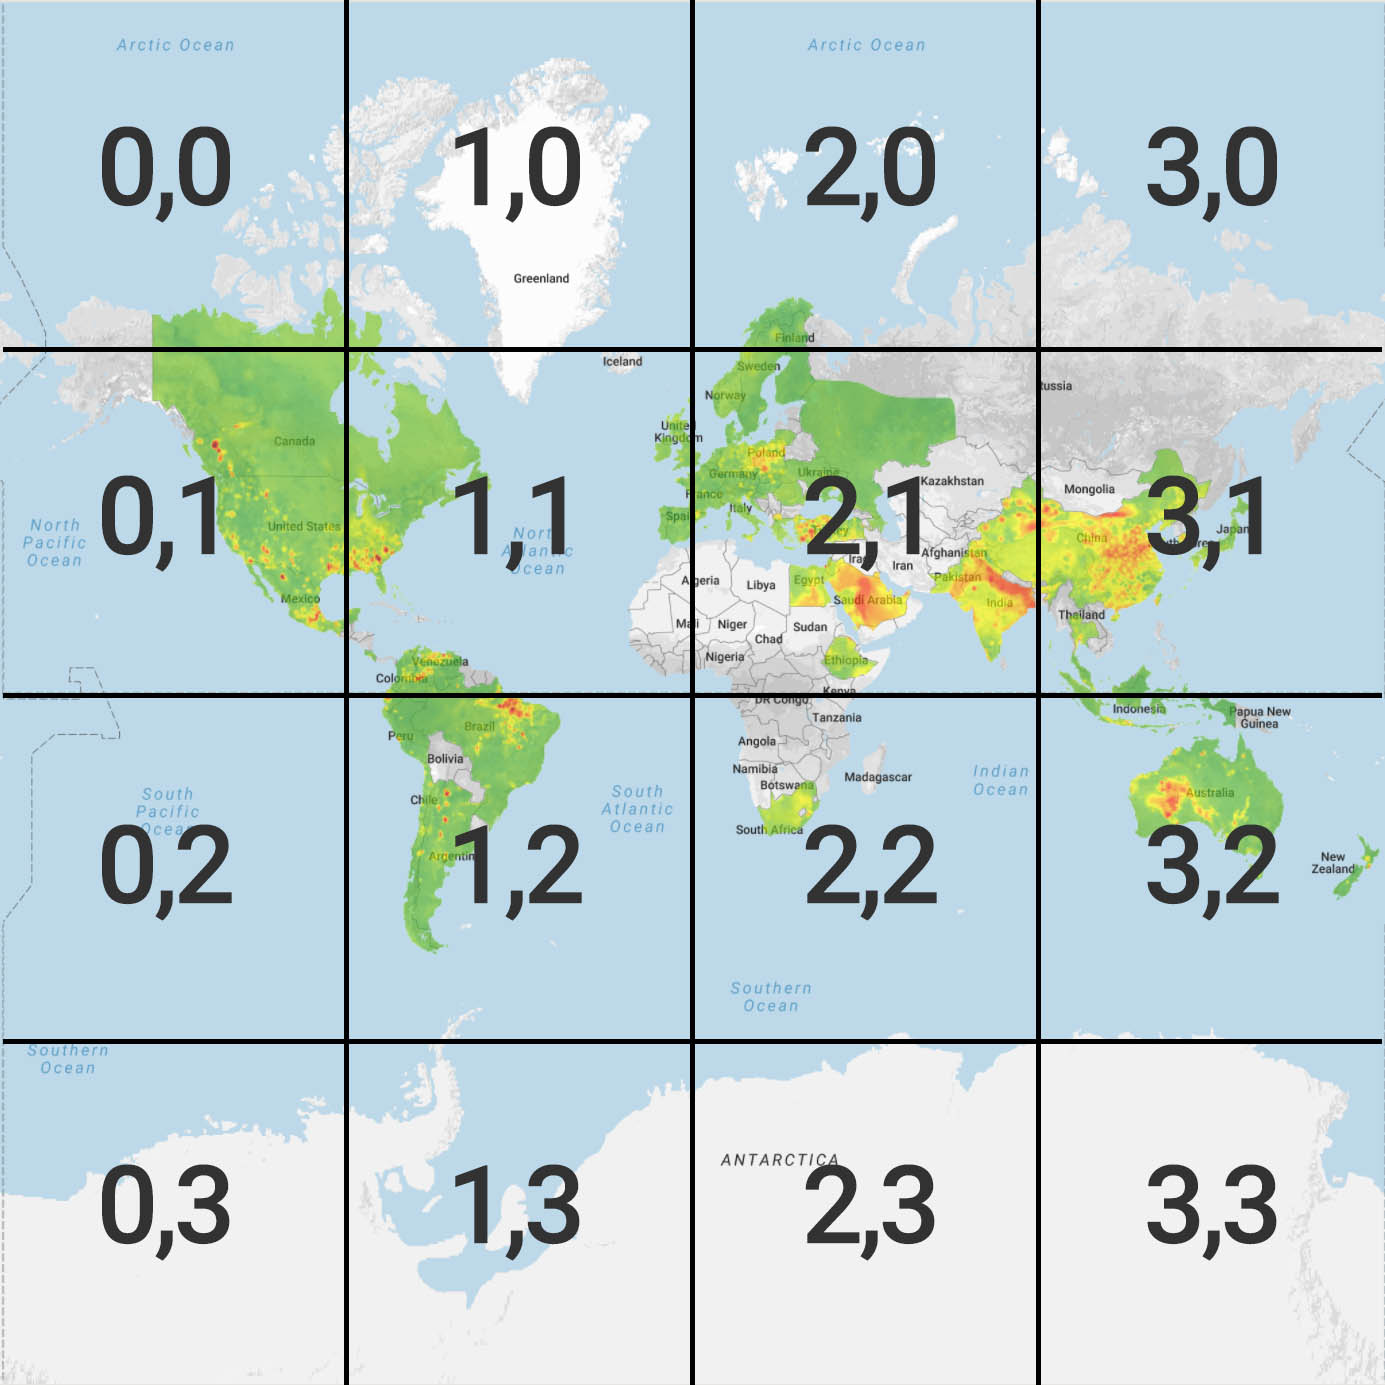
A tile overlay is a collection of image tiles that are displayed on top of a base map (such as Google Maps). Each image tile (256 x 256 pixels) is placed on the South-East side of an x/y location and scales according to the zoom level.
For the Air Quality Traffic Pollution heatmap, the returned data is a list of polylines that are displayed on top of a base map.
The BreezoMeter Air Quality and Pollen Heatmap Tile Overlay API supports tile-map services with Mercator Projection (opens new window), such as:
- Open Street Maps
- Here Maps
- Google Maps
- Leaflet
- ESRI ArcGIS Maps (for JavaScript)
- Mapbox
The tile overlay is a grid assembled from a collection of tiles, each assigned (X,Y) coordinates. The tile with coordinates (0,0) is always at the northwest corner of the map. The X values increase from west to east, while the Y values increase from north to south.
# For example:
# Air Quality
# Breezometer AQI
For the Breezometer AQI air quality heatmap, we support two different color palettes: ‘red_green’ (BreezoMeter’s legacy heatmap) and ‘indiper’ (BreezoMeter’s new heatmap). To get each of these color palettes, use the “breezometer_aqi_color” optional parameter while using the following endpoint: https://tiles.breezometer.com/v1/air-quality/breezometer-aqi/current-conditions/
For example, to get the Breezometer AQI air quality heatmap with the “indiper” color palette, concatenate the following API request: https://tiles.breezometer.com/v1/air-quality/breezometer-aqi/current-conditions/{z}/{x}/{y}.png?key=YOUR_API_KEY&breezometer_aqi_color=indiper
# Required parameters
Z- Zoom levelX- X coordinateY- Y coordinate
# Optional Parameters
breezometer_aqi_color- Sets the color palette of the image tiles returned.
Possible values:red_green- BreezoMeter’s legacy heatmap (default)indiper- BreezoMeter’s new heatmap
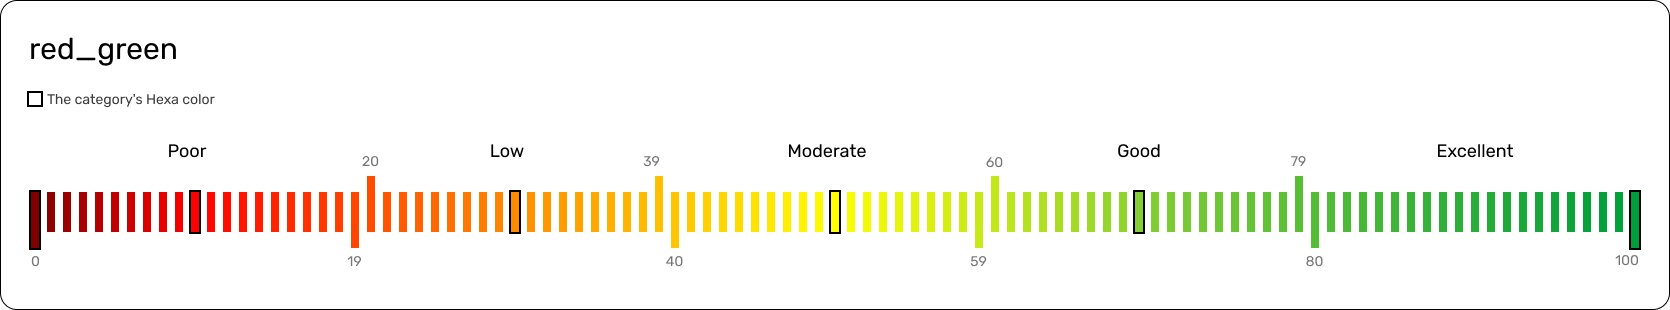 red_green
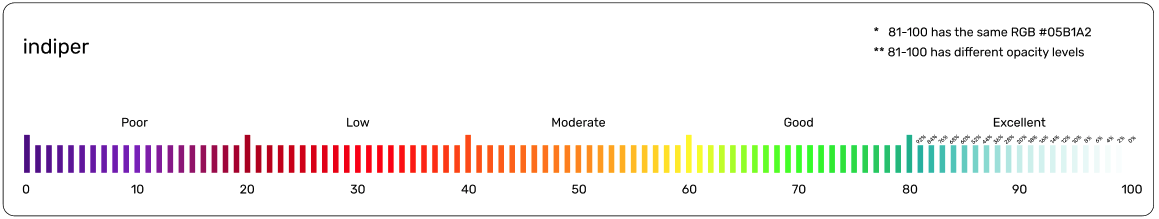 indiper
TIP
A tile image opacity of 65% is recommended for the red_green map overlay.
TIP
A tile image opacity of 70% is recommended for the indiper map overlay.
# Example
TIP
Make sure to place BreezoMeter's API key in the variable apiKey
<!DOCTYPE html>
<html lang="en">
  <head>
    <meta charset="utf-8" />
    <meta name="viewport" content="width=device-width, initial-scale=1.0, maximum-scale=1.0, user-scalable=no" />
    <title>BreezoMeter Tiles</title>
    <!-- Mapbox -->
    <script src="https://api.mapbox.com/mapbox-gl-js/v1.11.1/mapbox-gl.js"></script>
    <link href="https://api.mapbox.com/mapbox-gl-js/v1.11.1/mapbox-gl.css" rel="stylesheet" />
    <style>
      body {
        margin: 0;
        padding: 0;
      }
    </style>
  </head>

  <body>
    <div id="map" style="width: 400px; height: 300px;"></div>
    <script>
      var apiKey = ""; // Your BreezoMeter API key
      var mapBoxAccessToken = ""; // your mapbox access token from: https://account.mapbox.com

      var errorMessageBrz = "Update the variable 'apiKey' with a BreezoMeter API key to see the tiles. Contact BreezoMeter if you need any help:    breezometer.com/contact-us";
      var errorMessageMapbox = "Update the variable 'mapBoxAccessToken' with a Mapbox Access Token to initialize the Mapbox SDK. You can get it from:                https://account.mapbox.com";

      if (apiKey === "") alert(errorMessageBrz);
      if (mapBoxAccessToken === "") alert(errorMessageMapbox);

      var map = new mapboxgl.Map({
        container: "map",
        style: "mapbox://styles/mapbox/streets-v11", // your stylesheet location
        center: [-74.5, 40], // starting position [lng, lat]
        zoom: 9, // starting zoom
        accessToken: mapBoxAccessToken
      });

      map.on("load", function () {
        addRasterSource();
        addRasterLayer();
      });

      function addRasterSource() {
        map.addSource("breezometer-tiles", {
          type: "raster",
          tiles: [`https://tiles.breezometer.com/v1/air-quality/breezometer-aqi/current-conditions/{z}/{x}/{y}.png?key=${apiKey}&breezometer_aqi_color=indiper`],
          tileSize: 256,
          maxzoom: 8
        });
      }

      function addRasterLayer() {
        map.addLayer(
          {
            id: "breezometer-tiles",
            type: "raster",
            source: "breezometer-tiles",
            minzoom: 0,
            maxzoom: 22,
            paint: {
              "raster-opacity": 0.6
            }
          },
          "admin-1-boundary-bg"
        );
      }
    </script>
  </body>
</html>
# Traffic Pollution
The Traffic Pollution Vectors tiles are in Mapbox Vector tiles format (opens new window). The vectors are represented in pbf (Protocol Buffer) file format which Mapbox SDK knows how to read and display properly on a map.
For the Air Quality Traffic Pollution layer, use the following endpoint:
https://tiles.breezometer.com/v1/air-quality/traffic-pollution/current-conditions/
For example, to get the Current Conditions Air Quality Traffic Pollution heatmap, concatenate the following API request: https://tiles.breezometer.com/v1/air-quality/traffic-pollution/current-conditions/{z}/{x}/{y}.pbf?key=YOUR_API_KEY
# Required parameters
Z- Zoom levelX- X coordinateY- Y coordinate
# Response Data Fields
The response data is a list of polylines, where each polyline includes the following fields:
- Main road - widest road
- First level road
- Second level road
- Third level road
- Lowest importance - narrowest road
- c6h6: Benzene [ug/m3]
- co: Carbon Monoxide [ppb]
- nh3: Ammonia [ppb]
- nmhc: Non-Methane Hydrocarbons [ppb]
- no: Nitrogen Monoxide [ppb]
- no2: Nitrogen Dioxide [ppb]
- nox: Nitrogen Oxides [ppb]
- o3: Ozone [ppb]
- pm10: Inhalable Particulate Matter [ug/m3]
- pm25: Fine Particulate Matter [ug/m3]
- so2: Sulfur Dioxide [ppb]
- trs: Total Reduced Sulfur [ug/m3]
The polylines data does not include color values. In order to define the colors, please use the Custom BAQI color palette description as a reference.
# Example
TIP
Make sure to place BreezoMeter's API key in the variable apiKey
<!DOCTYPE html>
<html lang="en">
  <head>
    <meta charset="utf-8" />
    <meta name="viewport" content="width=device-width, initial-scale=1.0, maximum-scale=1.0, user-scalable=no" />
    <title>BreezoMeter Tiles</title>
    <!-- Mapbox -->
    <script src="https://api.mapbox.com/mapbox-gl-js/v1.11.1/mapbox-gl.js"></script>
    <link href="https://api.mapbox.com/mapbox-gl-js/v1.11.1/mapbox-gl.css" rel="stylesheet" />
    <style>
      body {
        margin: 0;
        padding: 0;
      }
    </style>
  </head>

  <body>
    <div id="map" style="width: 400px; height: 300px;"></div>
    <script>
      var apiKey = ""; // Your BreezoMeter API key
      var mapBoxAccessToken = ""; // your mapbox access token from: https://account.mapbox.com

      var errorMessageBrz = "Update the variable 'apiKey' with a BreezoMeter API key to see the tiles. Contact BreezoMeter if you need any help:    breezometer.com/contact-us";
      var errorMessageMapbox = "Update the variable 'mapBoxAccessToken' with a Mapbox Access Token to initialize the Mapbox SDK. You can get it from:                https://account.mapbox.com";

      if (apiKey === "") alert(errorMessageBrz);
      if (mapBoxAccessToken === "") alert(errorMessageMapbox);

      var map = new mapboxgl.Map({
        container: "map",
        style: "mapbox://styles/mapbox/streets-v11", // your stylesheet location
        center: [-74.5, 40], // starting position [lng, lat]
        zoom: 9, // starting zoom
        accessToken: mapBoxAccessToken
      });

      map.on("load", function () {
        addRoadsSource();
        addRoadsLayer();
      });

      function addRoadsSource() {
        map.addSource("roads", {
          type: "vector",
          tiles: [`https://tiles.breezometer.com/v1/air-quality/traffic-pollution/current-conditions/{z}/{x}/{y}.pbf?key=${apiKey}`],
          minzoom: 0,
          maxzoom: 10
        });
      }

      function addRoadsLayer() {
        map.addLayer(
          {
            id: "road-borders",
            source: "roads",
            "source-layer": "brz-roads",
            type: "line",
            layout: {
              "line-cap": "round"
            },
            minzoom: 3,
            maxzoom: 24
          },
          "admin-1-boundary-bg"
        );
      }
    </script>
  </body>
</html>
# PM2.5
The Air Quality PM2.5 heatmap is a dedicated heatmap for the PM2.5 pollutant which supports the ‘indiper’ color palette (BreezoMeter’s new heatmap).
In order to get the Air Quality PM2.5 heatmap, use the following endpoint:
https://tiles.breezometer.com/v1/air-quality/pm25/current-conditions/
For example, to get the Air Quality PM2.5 heatmap, concatenate the following API request:
https://tiles.breezometer.com/v1/air-quality/pm25/current-conditions/{z}/{x}/{y}.png?key=YOUR_API_KEY
# Required parameters
Z- Zoom levelX- X coordinateY- Y coordinate
TIP
A tile image opacity of 70% is recommended for the indiper map overlay.
TIP
Make sure to place BreezoMeter's API key in the variable apiKey
<!DOCTYPE html>
<html lang="en">
  <head>
    <meta charset="utf-8" />
    <meta name="viewport" content="width=device-width, initial-scale=1.0, maximum-scale=1.0, user-scalable=no" />
    <title>BreezoMeter Tiles</title>
    <!-- Mapbox -->
    <script src="https://api.mapbox.com/mapbox-gl-js/v1.11.1/mapbox-gl.js"></script>
    <link href="https://api.mapbox.com/mapbox-gl-js/v1.11.1/mapbox-gl.css" rel="stylesheet" />
    <style>
      body {
        margin: 0;
        padding: 0;
      }
    </style>
  </head>

  <body>
    <div id="map" style="width: 400px; height: 300px;"></div>
    <script>
      var apiKey = ""; // Your BreezoMeter API key
      var mapBoxAccessToken = ""; // your mapbox access token from: https://account.mapbox.com

      var errorMessageBrz = "Update the variable 'apiKey' with a BreezoMeter API key to see the tiles. Contact BreezoMeter if you need any help:    breezometer.com/contact-us";
      var errorMessageMapbox = "Update the variable 'mapBoxAccessToken' with a Mapbox Access Token to initialize the Mapbox SDK. You can get it from:                https://account.mapbox.com";

      if (apiKey === "") alert(errorMessageBrz);
      if (mapBoxAccessToken === "") alert(errorMessageMapbox);

      var map = new mapboxgl.Map({
        container: "map",
        style: "mapbox://styles/mapbox/streets-v11", // your stylesheet location
        center: [-74.5, 40], // starting position [lng, lat]
        zoom: 9, // starting zoom
        accessToken: mapBoxAccessToken
      });

      map.on("load", function () {
        addRasterSource();
        addRasterLayer();
      });

      function addRasterSource() {
        map.addSource("breezometer-tiles", {
          type: "raster",
          tiles: [`https://tiles.breezometer.com/v1/air-quality/pm25/current-conditions/{z}/{x}/{y}.png?key=${apiKey}`],
          tileSize: 256,
          maxzoom: 8
        });
      }

      function addRasterLayer() {
        map.addLayer(
          {
            id: "breezometer-tiles",
            type: "raster",
            source: "breezometer-tiles",
            minzoom: 0,
            maxzoom: 22,
            paint: {
              "raster-opacity": 0.6
            }
          },
          "admin-1-boundary-bg"
        );
      }
    </script>
  </body>
</html>
# Pollen
# Daily Forecast
For the daily forecast pollen heatmap, we support three main pollen types: tree, grass and weed. For each of the pollen types, you will get the heatmap for today pollen conditions. To get each pollen type heatmap use the following endpoint:
https://tiles.breezometer.com/v1/pollen/{POLLEN_TYPE}/forecast/daily/
For example, to get today's tree pollen forecast heatmap, concatenate the following API request:
https://tiles.breezometer.com/v1/pollen/tree/forecast/daily/{z}/{x}/{y}.png?key=YOUR_API_KEY
For all supported pollen types, please go to the Metadata Fields section on the Pollen API page
# Required parameters
Z- Zoom levelX- X coordinateY- Y coordinate
TIP
A tile image opacity of 65% is recommended for map overlay.
# Example
TIP
Make sure to place BreezoMeter's API key in the variable apiKey
<!DOCTYPE html>
<html lang="en">
  <head>
    <meta charset="utf-8" />
    <meta name="viewport" content="width=device-width, initial-scale=1.0, maximum-scale=1.0, user-scalable=no" />
    <title>BreezoMeter Tiles</title>
    <!-- Mapbox -->
    <script src="https://api.mapbox.com/mapbox-gl-js/v1.11.1/mapbox-gl.js"></script>
    <link href="https://api.mapbox.com/mapbox-gl-js/v1.11.1/mapbox-gl.css" rel="stylesheet" />
    <style>
      body {
        margin: 0;
        padding: 0;
      }
    </style>
  </head>

  <body>
    <div id="map" style="width: 400px; height: 300px;"></div>
    <script>
      var apiKey = ""; // Your BreezoMeter API key
      var mapBoxAccessToken = ""; // your mapbox access token from: https://account.mapbox.com

      var errorMessageBrz = "Update the variable 'apiKey' with a BreezoMeter API key to see the tiles. Contact BreezoMeter if you need any help:    breezometer.com/contact-us";
      var errorMessageMapbox = "Update the variable 'mapBoxAccessToken' with a Mapbox Access Token to initialize the Mapbox SDK. You can get it from:                https://account.mapbox.com";

      if (apiKey === "") alert(errorMessageBrz);
      if (mapBoxAccessToken === "") alert(errorMessageMapbox);

      var map = new mapboxgl.Map({
        container: "map",
        style: "mapbox://styles/mapbox/streets-v11", // your stylesheet location
        center: [-74.5, 40], // starting position [lng, lat]
        zoom: 9, // starting zoom
        accessToken: mapBoxAccessToken
      });

      map.on("load", function () {
        addRasterSource();
        addRasterLayer();
      });

      function addRasterSource() {
        map.addSource("breezometer-tiles", {
          type: "raster",
          tiles: [`https://tiles.breezometer.com/v1/pollen/grass/forecast/daily/{z}/{x}/{y}.png?key=${apiKey}`],
          tileSize: 256,
          maxzoom: 8
        });
      }

      function addRasterLayer() {
        map.addLayer(
          {
            id: "breezometer-tiles",
            type: "raster",
            source: "breezometer-tiles",
            minzoom: 0,
            maxzoom: 22,
            paint: {
              "raster-opacity": 0.6
            }
          },
          "admin-1-boundary-bg"
        );
      }
    </script>
  </body>
</html>