


# Environmental Alerts v1
BreezoMeter’s environmental alerts platform helps to define, manage and receive environmental alerts for users based on their location.
BreezoMeter’s alerts platform includes an API for sending a request for alert notifications based on the user's location, BreezoMeter’s Insights engine which is in charge of processing the data and running the logic, and a webhook that returns the results to your server/backend service (which can later be integrated as part of your notification service, UI, etc).
# Setting up the API
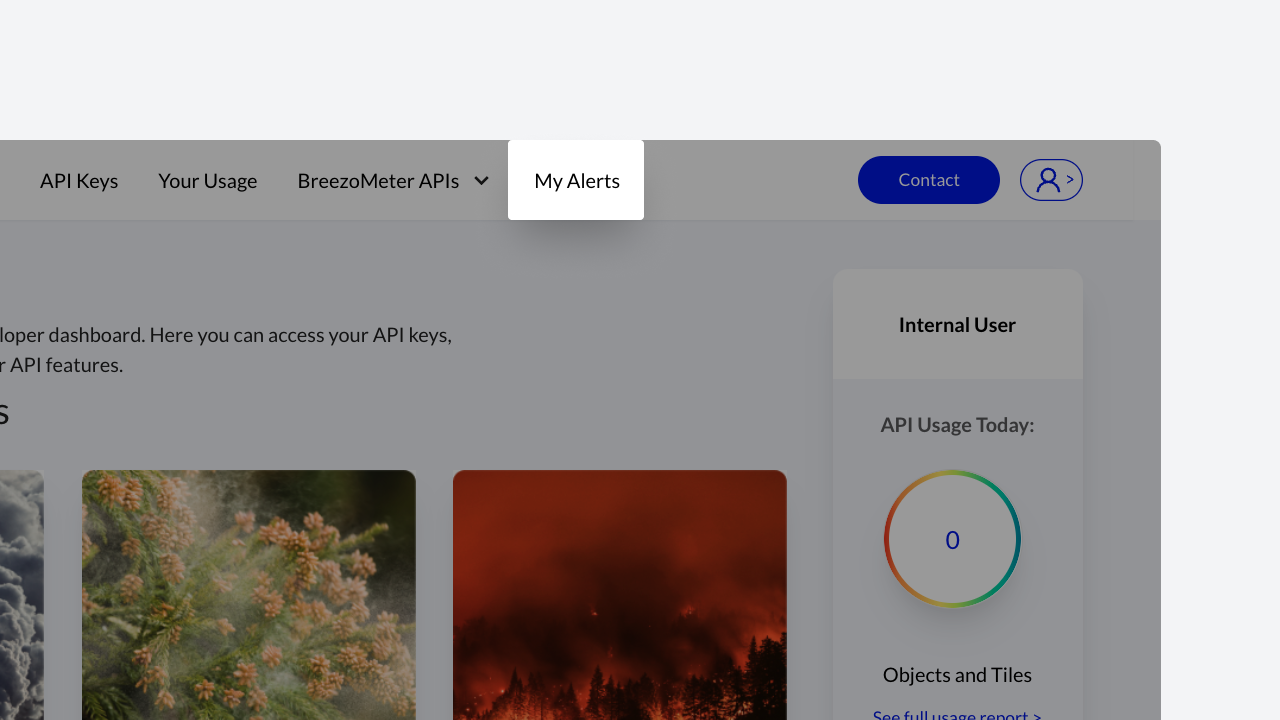
Follow this link to access the Developer's Dashboard: https://developers.breezometer.com/dashboard On the menu, click "My Alerts" to view the Environmental Alerts Settings screen
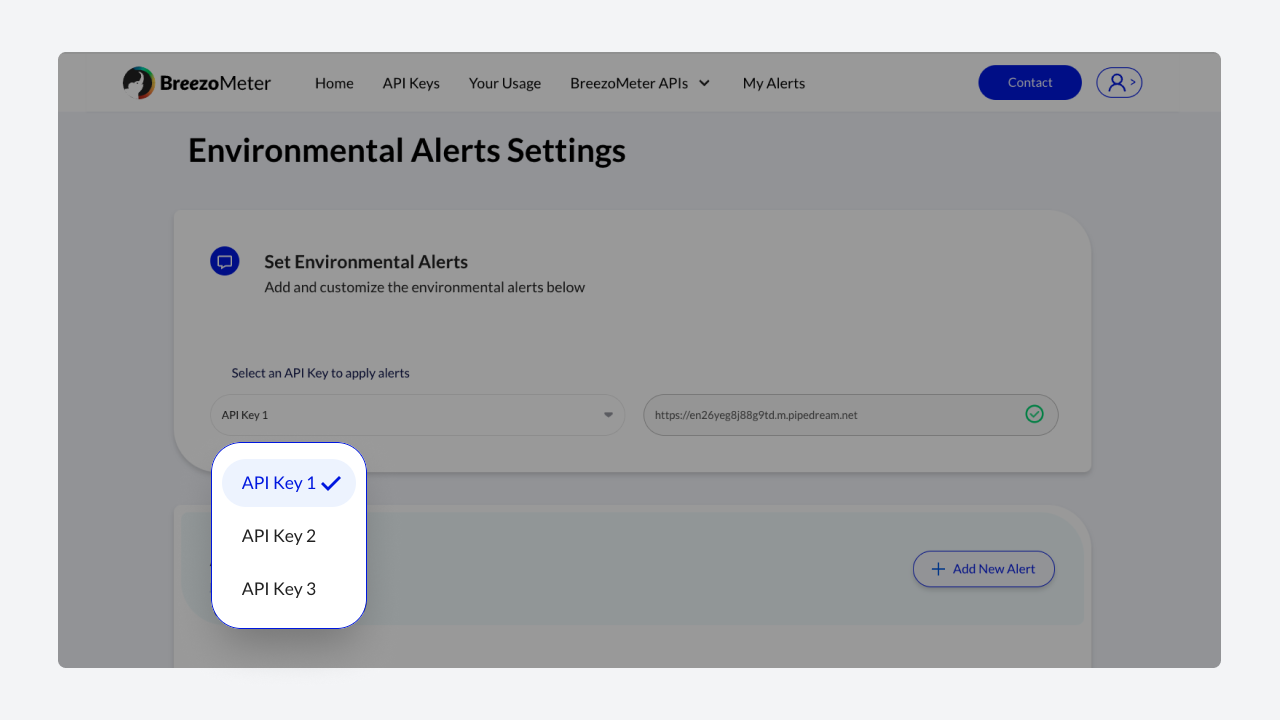
Select a key from the "Select an API Key to apply alerts" drop-down list on the "Environmental Alerts Settings" screen.
TIP
Note:
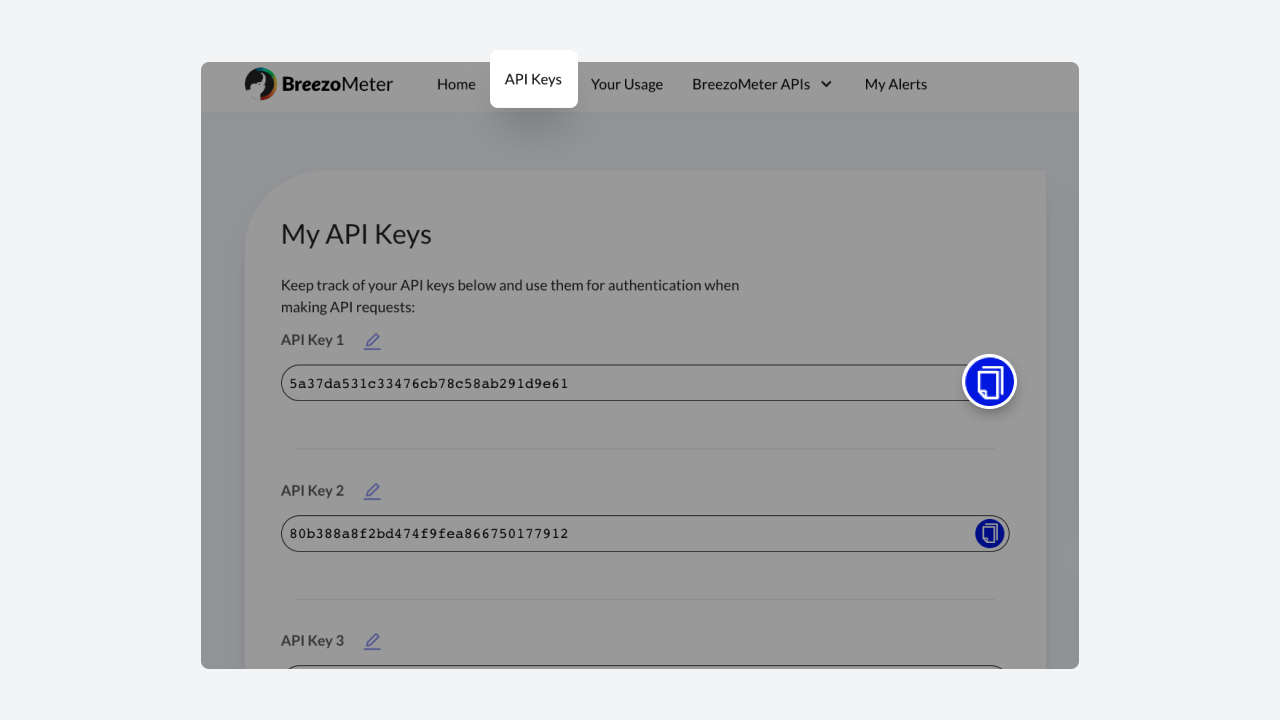
You can create a new API key to use for the Environment Alert API by clicking the "API Keys" link first.
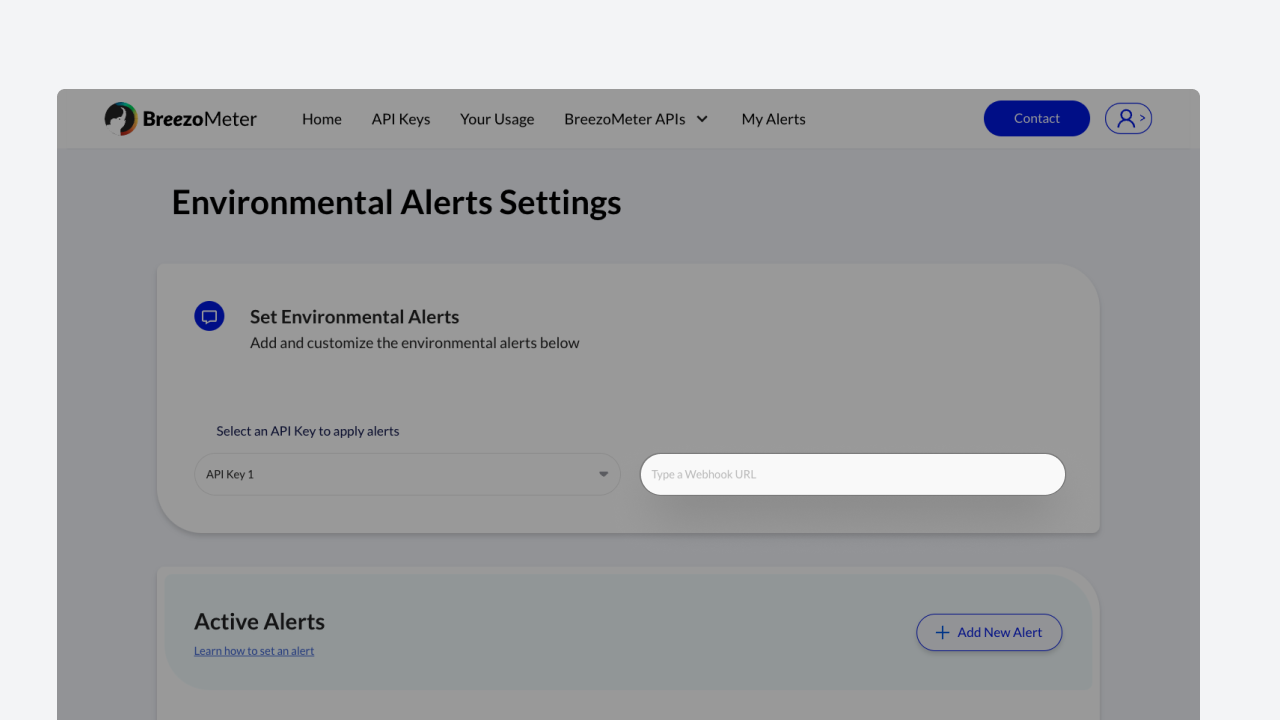
Assign an URL as the target for the response. This target URL is a “web hook” that your application must define and be able to access.
TIP
Note:
The URL that you specify in this text box, is your target server location (web hook), where the Insights Engine will send a URL that will allow your application to download the NDJSON data file from our secured Google Cloud Platform data storage. Please be aware that the link is only active for 15 minutes, and the data must be retrieved within this time period.
# Configuring Alerts
The Environmental Alerts dashboard gives access to edit or create new alert parameters based on different sets of environmental data.
To add a new alert click the “+ Add New Alert” link, then Choose the desired option from each dropdown selector: Type, Forecast, Trigger, and Message.
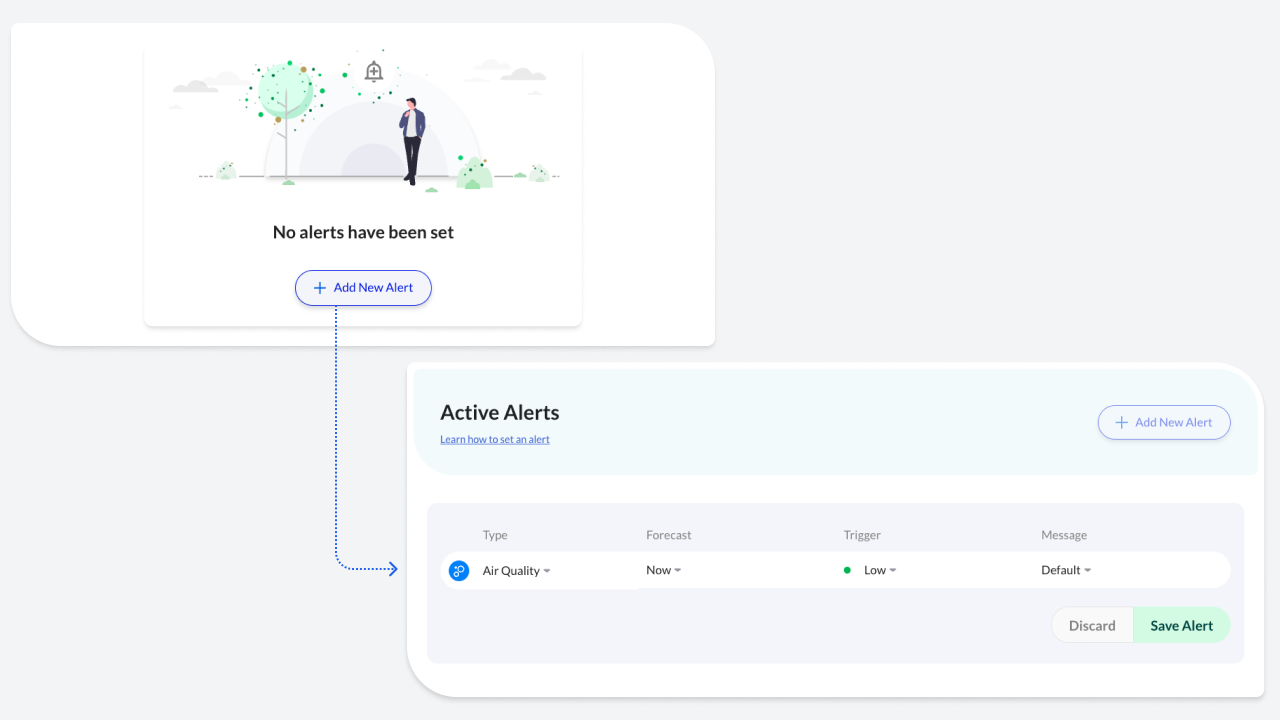
The dropdown selectors will help you customize the alert recommendations. You must select one of the following options from each dropdown selector:
# Type
Choose the relevant type of environmental data you’d like to set alerts for in order to begin (Air Quality or Pollen).
# Forecast
Select how many hours/days from now you’d like the system to check for a change in the environment.
# Sensitivity Trigger
The level of fluctuation that triggers an alert. This change includes both positive and negative fluctuations in the environment.
Low - large change in the environment will trip the trigger (index drastically changed)
Medium - moderate change in the environment will trip the trigger (index changed)
High - small change in the environment will trip the trigger (index slightly changed)
# Message
Each alert has pre-defined (default) messages based on the setup and how the thresholds are exceeded. Alternatively, the user can substitute user-defined alert messages for the default messages.
TIP
Note:
The user may customize the Alert Message (Description), but the predefined Recommendations are not customizable.
Here are some examples:
Air Quality Message
Description: In 24 hours the air quality is expected to be worse (56 AQI).
Recommendation: Pay attention to relevant symptoms and consider
reducing the intensity of outdoor activities.
Pollen Message
Description: Today Maple pollen levels will slightly rise.
Recommendation: Stay alert for any changes in pollen levels and your symptoms.
Please note that if you choose Custom you will be asked to fill in both a deterioration message and an improvement message.
# REST API POST Request
The Environmental Alerts Platform provides a single API endpoint that is POST command to the Insights Engine along with all the required data in its payload. The following section describes the endpoint, the content and syntax of the payload, along with the immediate response and subsequent data delivery.
# Request Data Fields
Set the following REST API request:
POST https://api.breezometer.com/insights/v1/cleanest-route?key={YOUR_API_KEY}
Add the desired geolocations as part of the Body (payload): "lon" : 114.11227386667582 , "lat" : 22.371480087645626 , "id" : "John's home" } , "lon" : 103.84162142534063 , "lat" : 1.3283529831557526 , "id" : "My office" } , "lon" : 98.398392 , "lat" : 7.878978 , "id" : "Alice's restaurant" } , "lon" : 99.58548665800006 , "lat" : 11.799537538500033 , "id" : "Golden Gate Bridge" } ] }
# Response Data Fields
The response data field is an object that includes the following fields:
TIP
Note:
Please note that this is not the same kind of response you receive from the Air Quality or Pollen Current Conditions, History or Forecast APIs. Rather, you receive a “token”.
# Token
A unique identifier that allows you to differentiate this call from other REST API POST responses.
As your application that submits the API POST request receives the above response (token), the BreezoMeter Environmental Alerts Platform uploads the data (in a NDJSON file) to a secured data store in the BreezoMeter Google Cloud Platform (GCP).
# Webhook Response
The URL to the data storage from where you can retrieve the ndjson file, is sent to the web hook URL that you configured in the Development Dashboard, that is associated with your API key. The webhook response will look something like this:
# INSIGHT_OUTPUT Example
KEY: Your_API_Key
TOKEN: 8dbfe4e4-e392-4f00-9b21-058471bec03f